Stocks and bonds are the most established financial assets providing global investment opportunities for long-term wealth building. However, in the short -term they can be risky investments due to their volatility.
Historically, long-term returns of the stock market have been positive, as have bonds. But over short periods stock and bond returns might be negative. Therefore, understanding historical stock and bond returns is critical if you want to be a successful investor. Historical stock and bond market returns provide information to help you make wise investment decisions.
Key Takeaways: Historical Investment Performance
- Stocks Outperform Long-Term: Over the last 97 years (1928–2025), the S&P 500 has delivered an average annual geometric return of approximately 10.02% including dividends.
- Bonds Provide Stability: Baa Corporate Bonds averaged a 6.62% annual return since 1928, offering a lower-volatility alternative that often performs well when equities struggle.
- The Power of 60/40: A balanced 60/40 portfolio—60% stocks and 40% bonds—has achieved a long-term average annual return of 8.66%, effectively tempering market swings while maintaining growth.
- Volatility is Normal: While long-term trends are positive, short-term returns can be highly volatile; for instance, stocks saw a -18.04% decline in 2022 followed by a 26.06% surge in 2023.
- Reversion to the Mean: Historical data suggests that extreme periods of overvaluation or undervaluation eventually revert toward long-run averages, reinforcing the importance of a disciplined, long-term investment strategy.
Historical Stock and Bond Returns-Why You Should Care
I’m a bit obsessed with historical stock and bond returns. While the future is unknowable, knowing historical stock and bond returns gives me a tool with which to view the current markets.
If you’re wondering why you should care about the average historical bond returns or stocks historical returns and performance, read on.
Knowing the average portfolio return helps you plan for the growth you might expect from your investments. Many investment calculators ask you to estimate the future return that you expect on your portfolio. Knowing the historical average returns on bonds and stocks is a good starting point to estimate your expected future investment returns.
For example, knowing 60/40 portfolio historical returns helps you estimate whether you’ll meet your financial goals. However, before we dive deeper, let’s understand some basics.
This article may contain affiliate links which means that – at zero cost to you – I might earn a commission if you sign up or buy through the affiliate link.
What Are Historical Returns?
Historical investment returns refer to the past performance and rate of return of a financial asset, such as a bond, stock, security, index or fund. For example, The average stock market returns over the past 96 years, as measured by the Standard and Poor’s 500 index is 9.94% including reinvested dividends.
We consider the geometric, not average annual returns for investments because it includes the effect of compounding growth from different periods of return. The geometric annual average return is considered a more accurate way to measure investment performance.
However, average bond returns by year, historical stock market returns, and even cash performance vary greatly each year. To make better estimates about future returns, it’s helpful to understand the bonds vs stocks historical returns for the last 50 years, 95 years, and 10 years.

Understanding Historical Stock and Bond Returns
To capture a financial asset’s historical returns, analysts and investors record performance from the start of a year (January 1st) to its end (December 31st). Compiling past annual returns helps you accurately picture your investments’ overall historical returns across multiple years. You can also use the same data to calculate average historic yields per year.
However, it’s essential to remember that the average returns fail to address potential changes in the rate of return. Some years may observe substantial growth, while others a decrease in performance. For example during the past five years, you’ll notice extremely divergent returns for stocks, cash, US Treasury and corporate bonds.
| Year | S&P 500 (with dividends) | 3-Month T Bill (Cash) | 10-Year T Bond (Treasury Bond) | Baa Corporate Bond |
| 2021 | 28.5% | 0.0% | -4.4% | 0.9% |
| 2022 | -18.0% | 2.0% | -17.8% | -15.1% |
| 2023 | 26.1% | 5.1% | 3.9% | 8.7% |
| 2024 | 24.9% | 4.97% | -1.64% | 1.74% |
| 2025 | 17.78% | 4.21% | 7.80% | 6.96% |
Source: https://pages.stern.nyu.edu/~adamodar/New_Home_Page/datafile/histretSP.html
Higher return years balance out the lower/negative returns over long periods of time. So, one-year returns might be lower or higher than the average, and rarely equal.
You can also use a historical returns calculator to make more informed decisions and maximize your returns. It calculates the potential return on investment over a period of time. It considers factors such as taxes, inflation, and investment period. You can also use it to compare different investments and choose the one with the best return potential.
Read: Would you Invest in a 100% Muni Bond Portfolio?
If you’re wondering what the average return is for someone invested 100% in bonds, both the US Treasury bond and Baa Corporate Bond returns will give you an idea of how bonds performed in the past. In general, over longer time periods, like seven or more years, stocks performed the best with trailing corporate bonds, government bonds and cash yields.


Average Return on Bonds
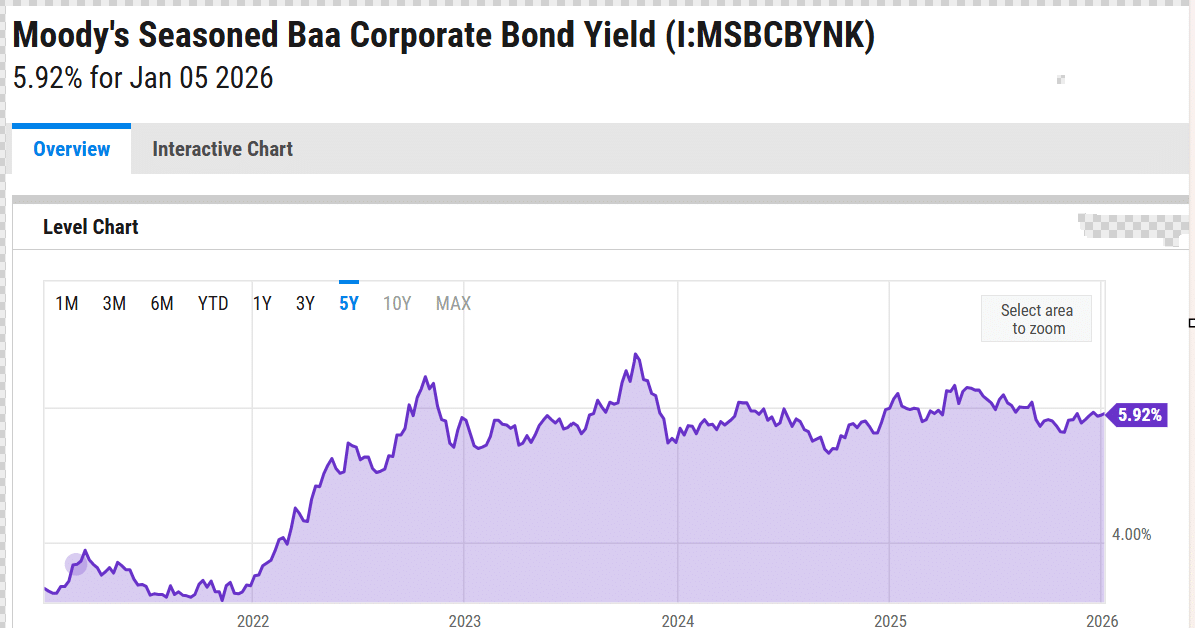
Source: https://ycharts.com/indicators/moodys_seasoned_baa_corporate_bond_yield
This 5-Year Average Baa Corporate Bond Yield chart shows the corporate bond yields, or interest payments during the prior five years. The yields along with the underlying bond price or value, will determine your annual return. If you don’t sell the bond, then you’ll receive the stated interest payment, and return of your principal investment, at maturity.
Great – so do historical returns guarantee future returns?
No, not at all.
But, since the perfect crystal ball hasn’t been invented, historical stock and bond returns give you an approximation of how much you might expect to earn on an investment portfolio, over many years. Historical stock and bond returns are the next best thing to the crystal ball.
Is it possible that historical returns have nothing to do with future investment returns?
Of course. But if we accepted that premise, we would lack any guide to approximating future returns. So, we’ll assume that past historical bond and stock, returns can help guide our future projections.
Historical Stock, Bond and Cash Returns
The following chart compares the annual returns of:
- Stocks – Measured by the S&P 500 index with reinvested dividends
- Bonds – Measured by the Baa Corporate Bond index
- Cash – Measured by the 3-month U.S. Treasury bonds
Stocks vs Bonds Historical Returns Chart – 25 Year
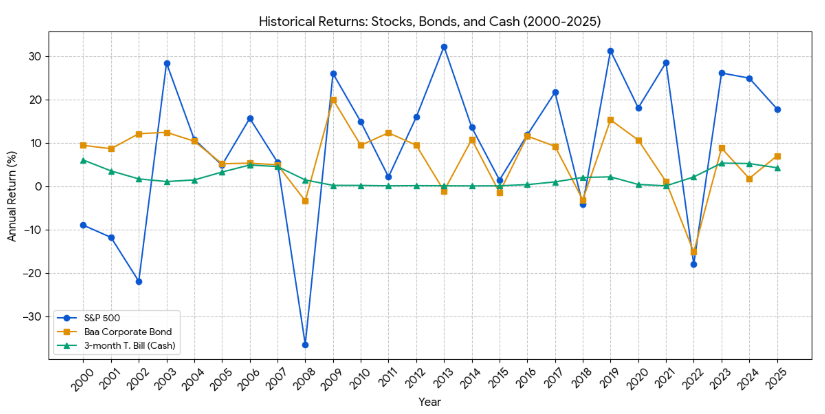
Data source: http://pages.stern.nyu.edu/~adamodar/New_Home_Page/datafile/histretSP.html
The annualized returns or Compound Annual Growth Rate (CAGR) for stocks, bonds and cash from 2000 to 2025 is as follows:
- S&P 500 (Stocks): 8.00%
- Baa Corporate Bonds: 6.30%
- 3-month T. Bills (Cash): 1.93%
Key Observations:
- Stock Outperformance: Despite major market crashes in 2000-2002 and 2008, stocks remained the top-performing asset class over the long-term, significantly outpacing both bonds and cash.
- Bond Stability: Baa Corporate Bonds provided a respectable return with considerably less volatility than stocks, making them an essential part of a diversified portfolio.
- Cash Drag: While T-Bills provide the most safety, their CAGR of 1.93% highlights the “inflation risk” of holding too much cash, as it often struggles to keep up with the rising cost of living over decades.
Notice that stock returns are usually higher than bond returns. There are large differences in stock and bond returns from year to year. During the last 50 years, stocks lost money in only six years, four of which were in the first decade of the new millennium.
The lesson is to keep your eye on stock valuations. When valuations get way ahead of the stocks intrinsic valuation, consider trimming back your stock holdings and shifting into more conservative cash and fixed income.
In some years, stocks and bond returns show an inverse relationship; when stocks go up, bonds go down. Yet, that’s not always the case. In 1995, all asset classes were positive. The S&P 500 returned over 37%, while Treasury bills and Treasury bonds returned 5.52% and 23.48%, respectively.
As high as the returns were in 1995, in 2008, during the subprime mortgage crisis and recession, the S&P 500 declined -36.55%. That same year, the 10-year Treasury bond rewarded fixed income investors with a 20.10% gain, as investors sought safer investments.
Rarely are stock and bond returns directly correlated. In 2022 stock and bonds both declined in value. In 2022, the S&P 500 lost -18.0% while the Baa Corporate Bond average lost -15.1%. While short-term cash investors held steady with a 2.0% T-bill return in 2022. This was the only year, during the past 50, when both stocks and bonds had significant declines.
Historically, stocks have the highest and lowest annual performance. Yet, during each 10-year period, long-term stock market returns have been positive.
The 3-month U.S. Treasury bill and cash proxy had positive returns and were the least volatile asset, with the lowest average returns.
Clearly, investing in stocks is the riskiest asset class with the most volatile returns and the potential for the greatest long-term returns. While bonds are less volatile with historically lower average returns.
As 2022 demonstrated, investors might consider adding cash to their portfolio in the form of 3-month Treasury Bills, certificates of deposit or high-yield cash accounts to temper the volatility of stock and bond portfolios.

Historical Returns for Stocks, Bonds and Cash for 97, 51 and 11 Years
The previous graph shows the 50-year annual return on stocks, corporate bonds and cash.
Next, we’ll explore the average annual returns for bonds, stocks, and cash during various periods.
Historical Stock and Bond Returns for Various Periods | 1928 – 2025

Data source: http://pages.stern.nyu.edu/~adamodar/New_Home_Page/datafile/histretSP.html
Key Updates:
- S&P 500 Growth: The strong performance of the S&P 500 in 2025 (17.78%) has pushed the nearly century-long average back above the 10% mark and significantly boosted the 11-year average to 13.41%.
- Bond Yields: Baa Corporate Bonds saw their 11-year average improve to 3.76%, recovering slightly from the low interest rate environment of the previous decade.
- Cash Proxy: The 3-month T-Bill average continues to reflect the higher-rate environment of 2023–2025, with the 11-year average now standing at 1.98%.
Investment returns vary depending upon the time period examined. This chart, and the previous, “50 Year Stock, Bond and Cash Returns” shows the performance for each asset class during the prior 97 years. “Average Historical Return (geometric)” explores the average returns over various periods. You’ll notice that in each period of time, returns were positive for stocks, bonds and cash assets.
Over 51 years, from 1975 through 2025 stocks averaged 12.37% annual returns while Baa Corporate Bonds delivered 8.59% on average, and cash yielded 4.25%.
This golden period included the -22% drop in the Dow Jones Industrial Average (DJIA) Black Monday stock market drop and the -20.4% S&P 500 decline on October 19, 1987. This 51 year stock market period also spans the irrational exuberance in the stock market during the buildup of the dot-com bubble from 1995 through 1999. The last five years of the 1990’s decade saw double digit stock market returns every year.
History reveals that all stock market bubbles reach a breaking point and the early 2,000’s experienced stock market declines during the first three years of the new millennium.
Examining the prior 11 years, 2015 to 2025, investment market returns were lopsided, due to historically low interest rates. The S&P 500 returned 13%+ on average with Baa Corporate Bonds and cash returning just 3.76% and 1.98% annually.
Historical Stock, Bond and Cash Returns from 2000 – 2025
| Year | S&P 500 (includes dividends) | Baa Corporate Bond | 3-month T.Bill (cash) |
| 2000 | -9.03% | 9.38% | 6.00% |
| 2001 | -11.85% | 8.60% | 3.48% |
| 2002 | -21.97% | 12.06% | 1.64% |
| 2003 | 28.36% | 12.38% | 1.03% |
| 2004 | 10.74% | 10.33% | 1.40% |
| 2005 | 4.83% | 5.13% | 3.22% |
| 2006 | 15.61% | 5.27% | 4.85% |
| 2007 | 5.48% | 4.90% | 4.48% |
| 2008 | -36.55% | -3.44% | 1.40% |
| 2009 | 25.94% | 19.96% | 0.15% |
| 2010 | 14.82% | 9.40% | 0.14% |
| 2011 | 2.10% | 12.26% | 0.05% |
| 2012 | 15.89% | 9.40% | 0.09% |
| 2013 | 32.15% | -1.13% | 0.06% |
| 2014 | 13.52% | 10.75% | 0.03% |
| 2015 | 1.38% | -1.50% | 0.05% |
| 2016 | 11.77% | 11.52% | 0.32% |
| 2017 | 21.61% | 9.15% | 0.95% |
| 2018 | -4.23% | -3.18% | 1.97% |
| 2019 | 31.21% | 15.25% | 2.11% |
| 2020 | 18.02% | 10.60% | 0.36% |
| 2021 | 28.47% | 1.02% | 0.04% |
| 2022 | -18.04% | -15.23% | 2.09% |
| 2023 | 26.06% | 8.74% | 5.28% |
| 2024 | 24.88% | 1.74% | 5.18% |
| 2025 | 17.78% | 6.96% | 4.21% |
If you began investing in the stock market in 2000, you would have been hit with three years of negative stock market returns. Stocks had to recover from their overvaluations at the end of the last millennium. But, with a diversified stock and bond portfolio, the stock market losses would have been tempered by the positive bond market returns.
We also saw the 2008 mortgage melt down with a -36% stock market loss. While 2022 attempted to return stocks to a more reasonable valuation, after the runup in valuations and returns from 2019 through 2021. With low inflation and low interest rates during most of this period, decent cash and fixed yields were hard to come by.
The Bolded returns above, show losing years for stocks and bonds. Notice that the positive return years, far outpace those with negative returns.
What does this mean going forward?
- If you had sold after markets fell, you might have missed the subsequent upswing in stock and bond returns.
- This data recommends that most investors should invest for the long-term in a diversified investment portfolio of stocks, bonds and a bit of cash.
- Don’t place money that you’ll need soon in the stock market, keep those dollars in short-term high yield cash investments.
Can we use historical returns to predict the future?

Reversion to the Mean Drives Future Investment Returns
“Mean reversion is a theory used in finance that suggests that asset prices and historical returns eventually will revert to the long-run mean or average level of the entire dataset.,” ~Investopedia
If mean reversion holds true, then you would expect that future financial asset returns going forward will return to the averages.
1995-1999 Stock Market Returns
During the last four years of the prior millennium, the S&P 500 returns were extraordinary with every year surpassing 22%:
| 1995 | 37.2% |
| 1996 | 22.7% |
| 1997 | 33.1% |
| 1998 | 28.3% |
| 1999 | 20.9% |
Most stock prices became overvalued and surpassed their intrinsic worth during the late 1990’s. With high returns and stock market overvaluation, the beginning of the new millennium began its journey to “reversion to the mean” and fair value, with losses from 2000 through 2002.
But, just because the stock market might be overvalued today, doesn’t mean that it will return to fair value soon!
Today, when the Price Earnings ratio is compared with its historical average, the S&P 500 stock market is overvalued. This is a valuation metric that considers the amount of money an investor is willing to pay for one dollar of corporate (or index) earnings. Today, the Shiller or CAPE PE ratio (the CAPE price earnings ratio is based on average inflation-adjusted earnings from the previous 10 years) is 40.8, compared with the average CAPE PE ratio of 17.33. Currently, investors are paying more than 100% more than average for one dollar of earnings.
2000-2009 Stock Market Returns
A stellar example of return to the mean is demonstrated during the first ten years of the millennium.
S&P 500 Average Annual Returns – 2000 to 2009
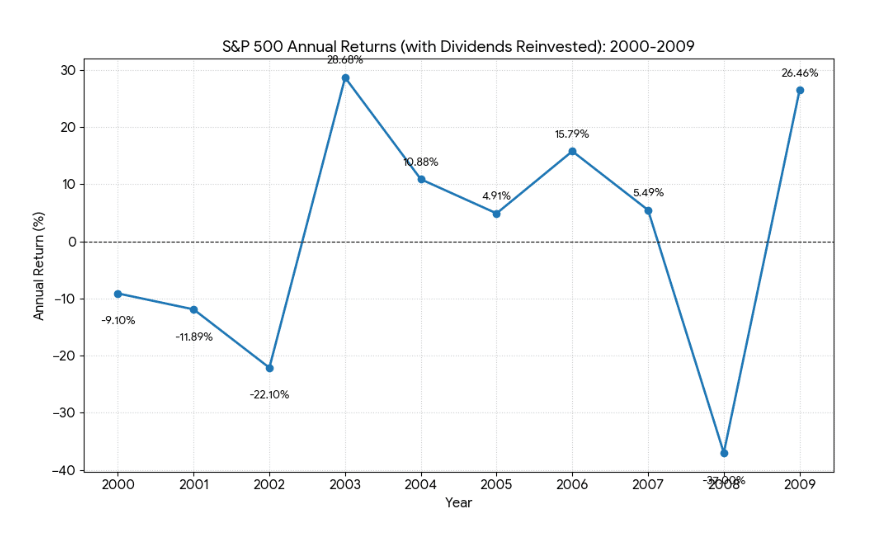
Data source; http://pages.stern.nyu.edu/~adamodar/New_Home_Page/datafile/histretSP.html
During the first three years of the decade, the stock market lost -9.10%, -11.89%, and -22.10%. If all of your investments were in the stock market, that would have been a painful three years.
During the first decade of the century, the average annual stock market return was negative -.726%, according to the DQYDJ.com S&P 500 calculator.
After the huge stock market runup in the late 1990s, the early 2000s is an ideal example of mean reversion.
2016 – 2025
After the dismal stock market returns at the beginning of the millennium, the most recent 10-year performance of the S&P 500 is outstanding:
- Stocks rebounded with an average 14.68%% return, inclusive of an 18.0% drop in 2022
- Baa Corporate bonds returned 4.29% during the past 10 years, predominantly due to historically low interest rates.
If you are seeking the answer to the question, ‘How will stock and bond markets perform in the future?’ it’s likely that you’ll find a range of responses from a variety of smart investment professionals. If reversion to the mean plays out, then you might expect a return to lower US stock returns, with bond and cash performance impacted by interest rates.
The volatility of investment markets is a reminder that stock and bond investing is best for money you won’t need for a long time.
Historical Bond Returns by Year
What is the average return if someone invested 100% in bonds?
Depending upon whether you invested 100% in 3-month Treasury bills, 10-year Treasury bonds or or corporate bonds your average returns during various periods were:
Historical Bond Returns for Various Periods | 1928 – 2025
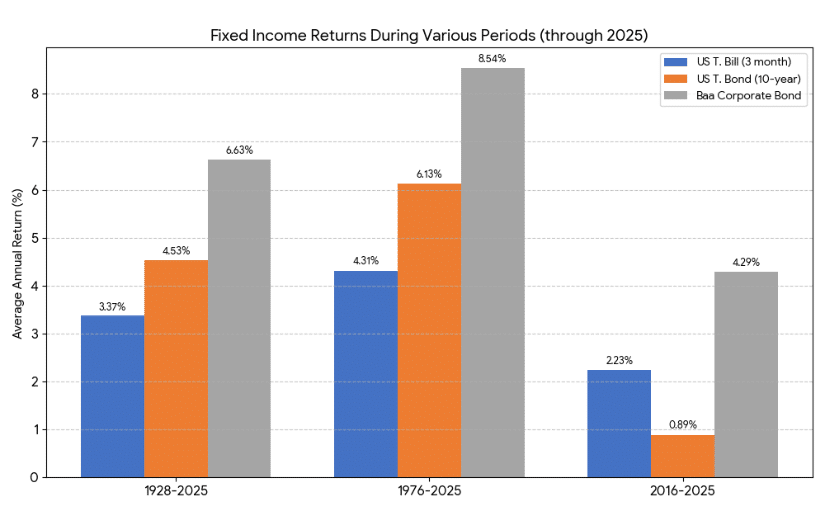
Data source; http://pages.stern.nyu.edu/~adamodar/New_Home_Page/datafile/histretSP.html
This Historical Bond Returns bar chart illustrates the average annual geometric returns for three types of fixed-income assets—3-month T-Bills, 10-year T-Bonds, and Baa Corporate Bonds—across three distinct time periods through 2025. Historically, Baa Corporate Bonds have consistently outperformed government securities, averaging a 6.63% return since 1928 and peaking at 8.54% during the 1976–2025 period. In contrast, the most recent decade (2016–2025) reflects a significant downward trend in yields, with 10-year Treasury Bonds returning just 0.89%. These variations highlight how bond performance shifts over time, often influenced by changing interest rate environments and economic cycles.
Bond Returns and Interest Rates
What about bond performance? Can we expect future bond yields to rise?
On January 31, 1986, the Baa corporate bond yield was 11.36%. Yet, as demonstrated by the graph at the beginning of the article, corporate bond yields have trended downward since 1986, with a few periodic reversals.
Bond yields are influenced by market interest rates. When market interest rates are high, bond yields tend to rise (while bond prices decline).
When market interest rates decline (and existing bond prices rise), new bond issues typically offer lower yields.
But yields are only one part of bond total returns, capital appreciation is another.
When interest rates rise, the bond values decline. The annual total return of a bond and a stock is the aggregate of both interest and dividend payments, and capital gains or losses.
Extremely conservative, or older investors seeking capital preservation, might lean towards investment portfolios with greater allocations to bond investments.
What are the Historical Returns of a 60/40 Portfolio?
What were 60/40 portfolio historical returns?
Many portfolio managers, financial planners and investors adhere to a 60/40 investment portfolio. This equates to 60% invested in stocks and 40% invested in bonds.
To calculate a 60/40 portfolio historical return, we’ll use the S&P 500 average returns for the 60% stock portion and the Baa corporate bond average returns for the 40% bond/fixed investment category. The diversification of a stock and bond portfolio will temper the ups and downs of your investments.
Your returns will vary depending upon how many distinct stock asset classes and types of bond assets you select, as well as the specific time period.
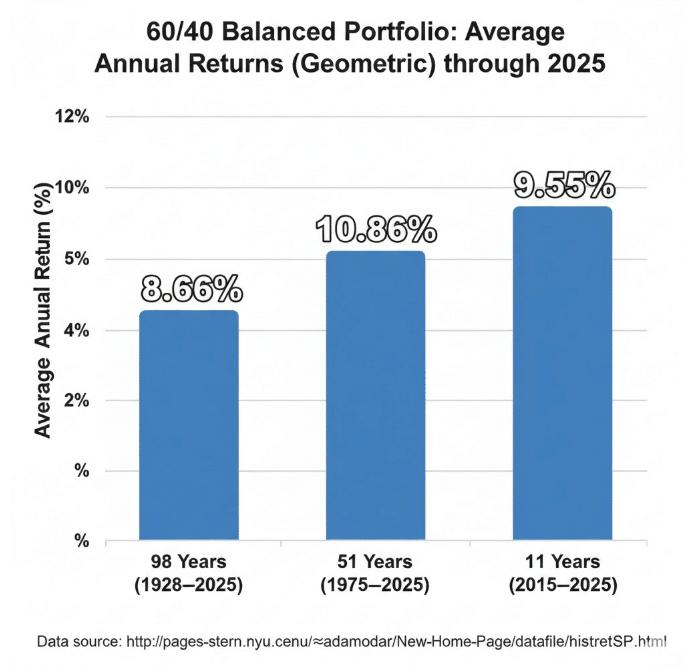
60/40 Balanced Portfolio Historical Returns Chart | Stocks vs. Corporate Bonds
Learn: Should I Buy Bonds Now?
Key Performance Insights:
- Long-Term Stability: Over nearly a century, a diversified 60/40 mix delivered a steady 8.66% annual return.
- Recent Outperformance: The 11-year average climbed to 9.55%, largely driven by the 17.78% surge in the S&P 500 during 2025.
- Risk Management: While a pure stock portfolio would have returned more, the 40% bond allocation provided a significant cushion during volatile years like 2022.
Stock and Bond Historical Asset Class Quilt
We’ve been discussing the broad stock market proxy, the S&P 500 and two bond categories, government and corporate. Within these broad categories, there are many types of investments, that have their own characteristics.
The table below, from NovelInvestor.com ranks the best to worst investment returns by asset class over the past 15 years.
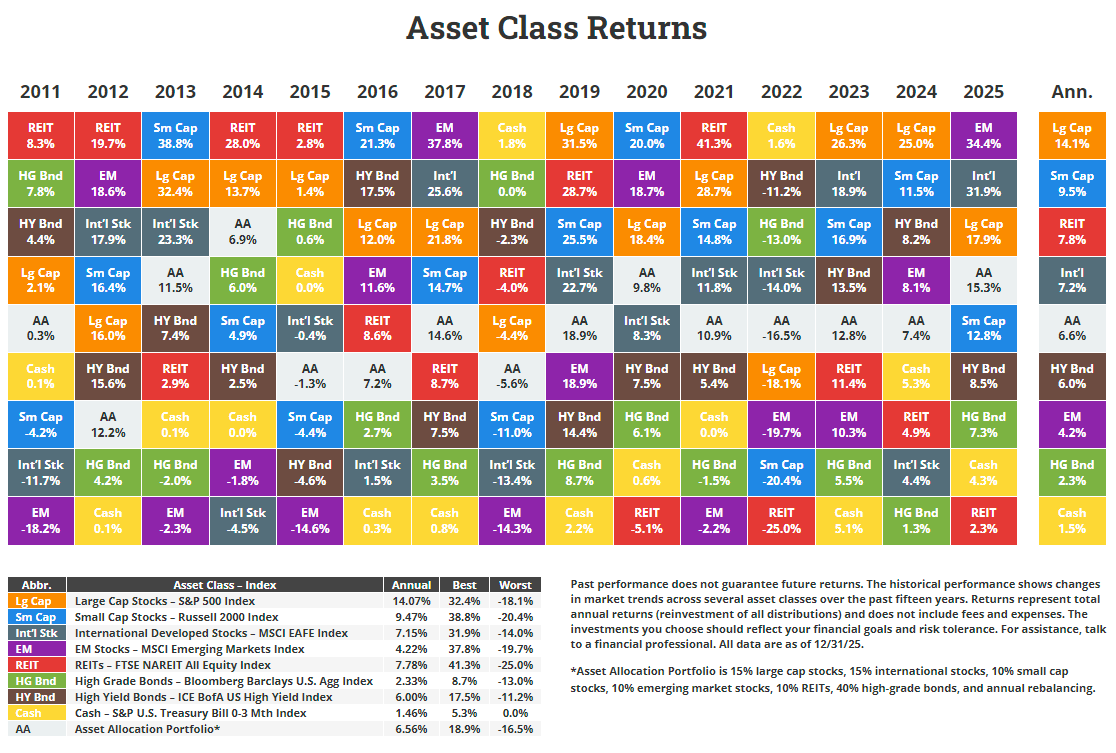 Source: NovelInvestor.com
Risk Tolerance and Historical Investment Returns, Why Historical Performance Matters for Your Asset Allocation
Your risk tolerance, or comfort with the ups and downs of your investment portfolio will drive your investment mix.
More conservative investors and those that are approaching retirement will lean towards an investment portfolio with a greater percent of bond and fixed income investments.
Younger and more aggressive investors will own greater percentages of stock investments.
This “Best Asset Allocation Based on Age and Risk Tolerance” Provides a rubrick for choosing your investment mix.
Risk tolerance and asset allocation templates are available online. Rick Ferri’s Core 4 website offers easy to craft investment portfolios.
After you’ve selected a reasonable asset allocation, then examine historical asset class returns to estimate expected future returns.
Be cautious of websites today that suggest future stock market returns will be greater than 9% or 10%. Maybe this will hold for a year or two, but the chances are slim that the stock market returns will match those of the previous decade.
Ultimately, you want to create a diversified investment portfolio, so if one asset class declines, total portfolio losses will be minimized, as other asset classes may remain stable or rise.
Stock and Bond Market Outlook for 2026
The stock market is highly valued, in contrast with historical metrics including the price earnings ratios. Interest rates have recently declined with further reductions expected this year. When stock market values are lofty, at some point they will return to fair value, suggesting that a market correction is in store. Yet, stock market valuations can remain elevated for years, before reversing course.
Vanguard and Grantham investments predict reduced annualized U.S. stock market returns of 3.5% to 5.5% during the next decade. With lower current valuations, international stock market annualized returns are predicted to range from 4.9% to 6.9%.
To protect against a stock market decline, consider adding bonds and high yield cash investments to your portfolio.
Historical Stock and Bond Returns Return Wrap Up | What Can We Learn from Historical Market Performance?
Understanding historical stock and bond returns is the cornerstone of building a resilient investment strategy. While past performance does not guarantee future results, the nearly 100-year history of the S&P 500 and corporate bonds provides a data-driven roadmap for long-term wealth building.
Quick Summary of Historical Averages (1928–2025):
- Equities: The S&P 500 remains the top growth engine, with a geometric annual return of 10.02%.
- Fixed Income: Baa Corporate Bonds provide essential stability, averaging 6.62% annually.
- Balanced Growth: A 60/40 portfolio has historically returned 8.66%, proving that diversification can mitigate risk without completely sacrificing returns.
Your Investing Next Steps:
- Assess Your Risk Tolerance: Use these historical benchmarks to decide if you can stomach the volatility required for stock market growth.
- Stay Disciplined: Remember that market downturns are part of the cycle; long-term averages typically reward those who remain invested.
- Review Your Portfolio: Ensure your current asset allocation aligns with your financial goals and the long-term averages discussed above.
No one can predict future investment returns. But, the educated investor who’s aware of the average bond returns and the average stock returns has a leg up on the less-informed investor. The most successful long-term investors take the time to learn about investment markets history.
FAQ
The historical average return of the stock market (S&P 500) between 1928 and 2025 is approximately 10% including dividends, as measured by the S&P 500 index. It’s important to remember that not everyone can expect this average rate of return as the markets are often unpredictable. Thus, conservative investors should lower their expectations and forecast a 7-8% long-term portfolio performance when investing in stocks. Historically, long- term stock market returns have been positive.
Over the last 30 years, the average annual return for stocks vs. bonds (measured by the SPY and BND ETFs) was 10.27% for stocks and 2.89% for bonds, with dividends reinvested. During this period, stocks saw six losing years, while bonds had five.
Yes. There have been several periods, most notably between 2000 and 2011, where bonds outperformed stock market returns. This often occurs during periods of high equity market volatility or significant market corrections, such as the 2008 recession and the bursting of the dot-com bubble in 2000 to 2003. .
A 60/40 portfolio (60% stocks, 40% corporate bonds) has delivered a 98-year average annual return of 8.66% with reinvested dividends. This diversified asset allocation is often used to temper the volatility of a 100% stock portfolio.
Historically, stocks and bonds have often shown a negative correlation, meaning they move in opposite directions. However, in rare years like 2022, both asset classes can decline simultaneously due to rising interest rates and inflation.
The 97-year average rate of return on stocks, as measured by the S&P 500, with reinvested dividends is 10.02%. During that same period, Baa corporate bonds returned an average of 6.62% and 3-month US Treasury bills (T Bills) delivered an average 3.32% return. During that same period a 60% stock vs 40% corporate bond portfolio delivered an average annual 8.66% annual return, with reinvestment of dividends.
If you need help with your investments, we’ve partnered with WiserAdvisor to provide you with access to three vetted Financial Advisors – in your area. Click the image below to sign up. (no obligation when signing up)
Related
- 7 alternatives To Cash – How To Get A Good Returns
- Are Bonds A Good Investment Now?
- Why Asset Allocation Is Important
- Is A 10% Return Good Or Bad?
- The Secret To Flawless Investment Management-For Free
Disclosure: Please note that this article may contain affiliate links which means that – at zero cost to you – I might earn a commission if you sign up or buy through the affiliate link. That said, I never recommend anything I don’t believe is valuable.
The statement is provided to you by Barbara Friedberg Personal Finance (“Promoter”) who has entered into a written referral agreement with Empower Advisory Group, LLC (“EAG”), through which Promoter will be paid for new leads through EAG. Promoter is not a client of EAG. Promoter is not affiliated with EAG or its affiliates and Promoter’s services consist solely of referrals of prospective clients.
No fees or other amounts will be charged to Personal Strategy clients, prospective clients, or any other clients of Promoter or EAG as a result of this arrangement. Investors should conduct their own research and seek advice before making investment decisions. For more information about EAG, refer to its Form ADV through the SEC’s website.

3 thoughts on “Historical Stock and Bond Returns – Predict Future Investment Performance”
Hello Ms. Friedberg,
I am a real estate appraiser in Ottawa Canada trying to help one of our Migmaw First Nations and the government of Canada settle a land claim originating in 1862.
I am looking for a time series of long bond rates for the US that goes back at least as far as 1862 to help me model the loss of use of the land. Do you possess such data and on what terms would you be willing to share it? I will leave my email below if you have any questions.
Thanks for your consideration,
Norris Wilson BA, AACI
Why do all the negative market comments fail to mention the heart of the US stock market, the Nasdaq 100? As you know it would be bigger than the S&P but the top 10 holdings include 9 Nasdaq stocks. The S&P is just the Nasdaq with 400 stocks that have not made much recently. These Nasdaq whales are the new railroad stocks of the world.
Why not encourage people with what is actually happening instead of spinning in whatever direction you must want to go? Do you tell the “savvy professionals” the real stuff?
The article is a thoughtful reminder that context matters when interpreting patterns. I use a lightweight Vedic astrology chart tool to review planetary placements before drawing conclusions.